PROCEED TO
Part 2: License Protection MattersNurse Professional Liability Claim Report
5th EDITION
For nearly half a century, we have been honored to support nurses by providing comprehensive malpractice insurance coverage. As the leading provider of malpractice protection for nurses, we understand the profound responsibility that comes with this role – not only to stand beside nurses when they need us most, but also to proactively contribute to a safer, stronger profession.
This claim report is part of our ongoing commitment to do just that.
Our claim reports are designed to provide nurses with valuable data and insights into trends and factors that drive malpractice allegations. Our goal is to help nurses recognize risks before they become realities, and to empower them with practical tools and strategies that can be integrated into everyday practice. By doing so, we aim to foster safer environments for nurses and for the patients in their care.
We recognize and deeply admire the dedication, compassion and professionalism nurses demonstrate every day. You are the backbone of healthcare. This report is for you: to support your work, to inform your decisions and to underscore our unwavering commitment to your success. It is a privilege to serve those who selflessly serve others.
Read MoreKey Findings of the Nurse Professional Liability Claim Report

The average total incurred increased 12.5 percent since the prior dataset, from $210,513 to $236,749.

The percentage of closed claims with an indemnity payment under $100,000 has decreased to less than 50 percent of the distribution in the 2025 dataset, while the percentage of closed claims above $750,000 has risen to 7.9 percent.

While LPN/LVN claims represented only 8.6 percent of the claims in the 2025 dataset, the average total incurred was 36.2 percent higher than RNs.

Claims involving home healthcare nurses remained the largest proportion of claims by specialty at 21.7 percent of the total distribution. In addition, the average total incurred increased significantly from $216,051 to $301,031, a total of 39.3 percent.
While obstetric-related claims decreased as a proportion of the total claims, these claims continue to have the highest average total incurred severity at $543,305.
The percentage of closed claims in aesthetics has not only doubled as compared to the 2020 dataset, but the average total incurred has increased by 25.9 percent from $104,132 to $131,148.

Although their primary responsibility is not providing direct care, nurse leaders are exposed to professional liability claims with an average total incurred of $160,595.

The average total incurred amount for emergency/urgent care has increased by more than $100,000, rising from $175,605 to $298,115.

Treatment/care was the most frequent allegation, representing 56.2 percent of the distribution. The average total incurred amount increased by 15.1 percent, from $209,937 to $241,645.

The average payment per license defense matter increased by 18.3 percent, from $5,330 in the 2020 dataset to $6,304 in the 2025 dataset.

Professional conduct complaints had the highest distribution of all license protection closed matters in the 2025 dataset, at 38.0 percent.
PART 1
Nurse Professional Exposures and Data Analysis
In partnership with Nurses Service Organization (NSO), CNA is the leading professional liability insurer for nurses. Since 2009, CNA and NSO have published reports reviewing professional liability claims experienced by insured nurses. This report aims to help nurses improve their practice and reduce liability risks by identifying loss patterns and trends through analysis of:
- Nurse specialties
- Healthcare delivery locations
- Allegations against the nurse
- Patient injuries associated with the claim
- License protection matters
Dataset and Methodology
Within this report, three datasets are used to illustrate changes in the distribution and severity of claims between reports. In total, the 2025 dataset (with five years of data) consists of 466 professional liability (PL) closed claims that met the following criteria:
- Involved a registered nurse (RN), licensed practical nurse (LPN)/licensed vocational nurse (LVN), nursing student or healthcare business;
- Closed between January 1, 2020, and December 31, 2024;
- Resulted in an indemnity payment of $10,000 or greater.
Limitations and Considerations
- Indemnity and expense payments include only monies paid by CNA on behalf of its insureds.
- The data reflects the “per claim” policy limits, which are typically $1,000,000 for CNA/NSO primary professional liability insurance.
- Other possible sources of payment, such as payments by co-defendants in response to the claim, are not considered.
- All incurred indemnity and expense amounts are attributed to the year the claim closed, regardless of when the claim was first reported or when the alleged injury occurred.
- Because of the uniqueness of each individual claim, the average total incurred amounts displayed within this report may not necessarily be indicative of the severity attributed to any single claim.
- As some elements of the inclusion criteria in each dataset may differ from that of the previous CNA/NSO claim analyses and claim reports from other organizations, readers should exercise caution about comparing these findings with other reports.
Terms
For the purposes of this report only, please refer to the following terms and explanations.
2015 dataset
A reference to the prior CNA report, entitled “Nurse Professional Liability Exposures: 2015 Claim Report Update” which included data from 2010-2014.
2020 dataset
A reference to the prior CNA report, entitled “Nurse Professional Liability Exposure Claim Report: 4th Edition, Minimizing Risk, Achieving Excellence” which included data from 2015-2019.
2025 dataset
A reference to this CNA report, entitled “Nurse Liability Claim Report: 5th Edition” which includes data from 2020-2024.
Distribution
Refers to a specific group of closed claims with categories expressed as a percentage of the total.
Expense payment
Monies paid in the investigation, management, or defense of a claim, including, but not limited to, expert witness expenses, attorney fees, court costs, and record duplication expenditures.
Indemnity payment
Monies paid on behalf of an insured in the settlement or judgment of a claim.
Total incurred
The sum of total paid indemnity and expense payments.
Average total incurred
The costs of total paid indemnity and expense payments, divided by the total number of claims with payment.
1
Comparison of Average Total Incurred
Closed Claims with Paid Indemnity of ≥ $10,000
2015
$201,670
2020
$210,513
2025
$236,749
2
Comparison of Closed Claim Count Distributions
Closed Claims with Paid Indemnity of ≥ $10,000
$1,000,000
3.1%
3.7%
4.5%
$750,000 to $999,999
2.7%
1.3%
3.4%
$500,000 to $749,999
3.8%
4.6%
4.5%
$250,000 to $499,999
10.6%
15.9%
13.7%
$100,000 to $249,999
20.9%
23.8%
25.4%
$10,000 to $99,999
58.8%
50.7%
48.5%
Comparison of Average Total Incurred and Claim Count Distributions
While the increase in claim severity is multifactorial and largely depends upon the individual facts and circumstances of each case, it is important to consider industry trends, such as tort inflation. Tort inflation occurs when the overall rate of increasing claim severity is greater than the general inflationary rate. This can result from political, legal, and cultural factors that influence societal views toward jury awards and claim settlement values. Exceptionally high jury awards are on the rise across the United States and are often disproportionate to the facts of the case and injuries. These verdicts are driven by an emotional appeal to jurors’ sympathy, societal distrust, and inflated punitive damages.
The average total incurred increased 12.5 percent since the prior dataset, from $210,513 to $236,749.
The percentage of closed claims with an indemnity payment under $100,000 has decreased to less than 50 percent of the distribution in the 2025 dataset, while the percentage of closed claims above $750,000 has risen to 7.9 percent.
Closed Claims by Indemnity and Expense Payments
While this section of the report focuses on professional liability (PL) claims with indemnity payments, claims that resolved without an indemnity payment may nevertheless incur costs. The average expense payment for closed claims without an indemnity payment was $17,915 in the 2025 dataset. Expenditures can include attorney fees, expert witness fees, and costs involved in investigating the claim. Claim expenses can vary widely due to the unique circumstances of each matter.
At times, a claim may resolve without an indemnity payment for various reasons, such as:
- Claim was successfully defended on behalf of the insured, resulting in a favorable jury verdict.
- Claim was withdrawn by the plaintiff during the investigation or discovery process.
- Claim was dismissed by the court prior to trial in favor of the insured defendant.
The time from when an incident occurs to when a claim or lawsuit is closed varies depending upon multiple factors including, but not limited to, the applicable statute of limitations, court calendars and the complexity of the matter. The fact that a PL claim with indemnity payment may take, on average, 4.2 years to close, as seen in Figure 3, underscores the importance of comprehensive documentation to preserve relevant patient information. Documentation of the nursing assessment, care plan, and response to nursing interventions is integral in demonstrating that the standard of care was met. Concise and thorough documentation is also critical in defending license protection matters and/or preparing the insured for a deposition.
3
Closed Claims by Coverage Category
Average Total Incurred
Average Years to Close
$236,749
4.2 yrs
$17,915
4.4 yrs
$6,304
2.3 yrs
Closed Claims by Insured Type
- While LPN/LVN claims represented 8.6 percent of the claims in the 2025 dataset, Figure 4 indicates an average total incurred for LPN/LVN claims that was 36.2 percent higher than RNs.
- Healthcare businesses have a slightly lower severity than LPN/LVN’s; however, they are a larger percentage of the distribution of claims at 21.9 percent as evidenced in Figure 4. Healthcare businesses include various types of organizations such as home healthcare agencies, staffing companies and medispas, among others.
Approximately half of the closed claims involving LPNs/LVNs were related to home healthcare, a higher severity specialty, which contributed to higher-than-average costs for LPN/LVN claims. The increase is attributable, in part, to the inherent risks in the home healthcare setting, such as environmental hazards and the responsibilities of being the sole healthcare provider on-site without direct supervision.
4
Closed Claims by Insured Type
Closed Claims with Paid Indemnity of ≥ $10,000
Distribution
Average
Total Incurred
Total Incurred
69.3%
$215,544
21.9%
$283,339
8.6%
$293,507
<1%
$63,780
$236,749
Many high-severity LPN/LVN closed claims involved the care and treatment of high acuity patients with multiple comorbidities and complex medical conditions, such as ventilator dependency, neurological birth injuries, paralysis, and postoperative complications.
An example of an LPN/LVN claim involving a patient with postoperative complications is noted on the link below.
While LPN/LVN claims represented only 8.6 percent of the claims in the 2025 dataset, the average total incurred was 36.2 percent higher than RNs.
Professional Liability Risks for LPNs/LVNs

Specialties
Home healthcare
Gerontology in aging services facility
Correctional health
Gerontology in aging services facility
Correctional health

Allegations
Treatment/care
Assessment
Patient’s rights/abuse/professional conduct
Assessment
Patient’s rights/abuse/professional conduct
Common Areas of Liability Risk for LPNs/LVNs

Locations
Patient’s home
Aging services facility
Correctional facility
Aging services facility
Correctional facility

Injuries
Death
Fracture/dislocation
Infection/abscess/sepsis
Fracture/dislocation
Infection/abscess/sepsis
Healthcare Businesses
Vicarious liability is the exposure that a healthcare business owner assumes for the negligent actions of employees and supervisees. These exposures are derived from the inherent duties associated with ownership, such as hiring, screening, supervision, and policy management, as well as vicarious liability.
Analysis of Claim Outcomes by Specialty, Location, Allegation and Injury
This section of the report provides selected findings on PL claims from the 2025 dataset with comparisons to the 2020 dataset. PL claims included in this section resulted from a demand for money, in which an insured is named, and professional malpractice is alleged. The demand may have been asserted by a patient, a surviving family member or estate, or an attorney representing the plaintiff.
Our goal is to help nurses enhance their practice and minimize PL exposures by identifying loss patterns and trends in the following categories:
- Specialty
- Location
- Allegation
- Injury
This section features claim scenarios that highlight potential risks and associated liability exposures experienced by nurses, providing the reader with strategies to recognize and mitigate these exposures.
Figures 5 and 6 provide a summary of the total claim distribution and average total incurred amounts for professional liability closed claims included in the 2025 dataset by top specialties.
Analysis by Specialty
5
Distribution of Closed Claims by Specialty
Closed Claims with Paid Indemnity of ≥ $10,000
Home healthcare
20.7%
21.7%
Adult medical
7.7%
12.0%
Gerontology – limited to practice in aging services facility
10.5%
12.0%
Surgical
14.9%
9.4%
Pediatric
0.7%
6.7%
Emergency/urgent care
9.7%
6.4%
Correctional health
4.4%
6.0%
Aesthetics/cosmetics
2.2%
4.5%
Critical care
7.5%
3.9%
Obstetrics
6.2%
3.9%
6
Average Total Incurred by Specialty
Closed Claims with Paid Indemnity of ≥ $10,000
Obstetrics
$558,007
$543,305
Surgical
$145,118
$332,847
Home healthcare
$216,051
$301,031
Emergency/urgent care
$174,866
$296,280
Correctional health
$219,924
$270,420
Critical care
$240,394
$162,046
Gerontology – limited to practice in aging services facility
$145,685
$152,723
Pediatric
$235,197
$133,592
Aesthetics/ cosmetics
$104,132
$131,148
Adult medical
$163,524
$119,287
The following claim scenarios highlight exposures that contributed to the higher average total incurred for closed claims involving these specialties:
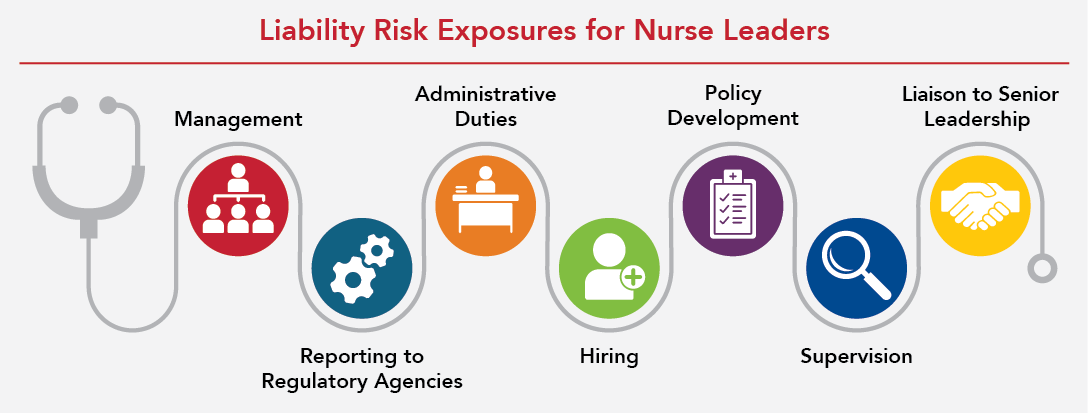
Analysis of Claims for Nurses in Leadership Roles
As highlighted in Figure 7, the majority of closed claims in the 2025 dataset involved nurses who provided direct patient care. However, there were also closed claims that involved nurses in leadership roles. These claims were most often related to management or administrative responsibilities, such as hiring and supervision, policy development, and reporting to regulatory agencies. For this analysis, nurses in leadership roles included directors of nursing, nurse managers, charge nurses, and owners of healthcare organizations.
Figure 7 provides a summary of closed claim distribution and average total incurred for direct care nurses and nurse leaders.
7
Closed Claims for Nurses in Leadership Roles
Closed Claims with Paid Indemnity of ≥ $10,000
Distribution
Average Total Incurred
86.1%
$249,094
13.9%
$160,595
Although their primary responsibility is not providing direct care, nurse leaders are exposed to professional liability claims with an average total incurred of $160,595.
Nurse Spotlights
For risk control strategies related to:
- Protecting Your License
- Documentation
- Artificial Intelligence - Coming soon!
- Technology in Nursing - Coming soon!
- Liability for Charge Nurses - Coming soon!
- Well-being and Mental Health - Coming soon!

Definitions of Nurse Leadership Roles
The analysis of leadership roles for nurses involved in closed claims were categorized in the 2025 dataset as follows:
Director of nursing (DON)
An RN whose role includes hiring, budgeting and implementing policies. DONs act as a liaison between leadership and department managers.
Nurse manager
A nurse whose role includes scheduling, supervising, and implementing nursing educational programs. Nurse managers often serve as a liaison between staff nurses, providers, and upper management.
Charge nurse
A nurse who oversees a nursing unit during a set period while also providing direct patient care. The primary roles of a charge nurse are to promote safe nursing care, to provide support for staff nurses, and to act as a liaison between nurses and providers.
8
Closed Claims for Nurse Leaders by Position
Closed Claims with Paid Indemnity of ≥ $10,000
Distribution
Average Total Incurred
44.6%
$103,870
26.2%
$177,552
16.9%
$266,637
12.3%
$184,380
Figure 8 provides a summary of the closed claim distribution and average total incurred amounts for nurse leaders by positions.
9
Closed Claims for Nurses in Leadership Roles by Allegation
Closed Claims with Paid Indemnity of ≥ $10,000
Distribution
Average Total Incurred
30.8%
$83,037
26.2%
$210,567
24.6%
$200,132
Figure 9 represents the most common allegations and the average total incurred amounts in closed claims involving nurse leaders.
The following claim scenario provides an example of one of the most common allegations experienced by nurses in leadership roles – failure/delay in reporting to a regulatory agency.
The insured RN was the DON in a residential facility for a compromised resident population. The DON was notified that several residents had become ill with fever and respiratory symptoms and had tested positive for a highly contagious virus. The DON failed to notify the State Department of Health in a timely manner. This failure to notify resulted in a delay in initiating a quarantine that allegedly led to an outbreak with multiple patient deaths. Collectively, these claims settled for more than $975,000.
10
Distribution of Closed Claims by Location
Closed Claims with Paid Indemnity of ≥ $10,000
Patient’s home
21.8%
21.5%
Aging services facility
11.2%
15.0%
Hospital – inpatient
6.6%
11.6%
Correctional facility
4.4%
6.2%
Emergency/urgent care
9.9%
6.0%
11
Average Total Incurred by Location
Closed Claims with Paid Indemnity of ≥ $10,000
Emergency/urgent care
$175,605
$298,115
Patient’s home
$210,325
$277,503
Correctional facility
$219,924
$262,272
Aging services facility
$141,185
$179,428
Hospital – inpatient
$168,820
$117,877
The following scenarios illustrate location-specific closed claims with a higher distribution and/or above average total incurred:
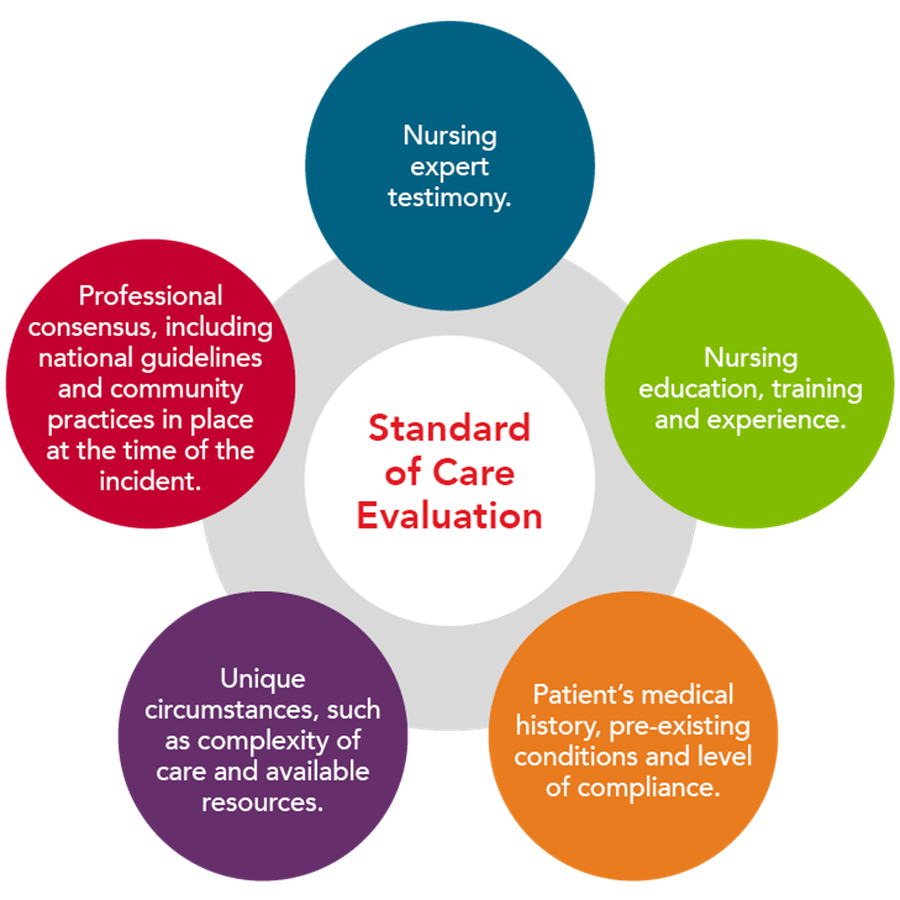
Assessment
The items below are excerpts from the ANA Scope and Standards of Practice relative to nursing assessment. The full list of competencies related to assessment can be found in the ANA Scope and Standards of Practice, 4th Edition, 2021, Standard 1. Assessment.

Collects pertinent data related to health and quality of life in a systematic, ongoing manner, with compassion and respect for the wholeness, inherent dignity, worth and unique attributes of every person.

Prioritizes data collection based on the healthcare consumer’s immediate condition, the anticipated needs of the healthcare consumer or situation, or both.

Identifies enhancements and barriers that are needed for effective communication.

Recognizes the impact of one’s own personal attitudes, values, beliefs, and biases on the assessment process.
12
Distribution of Closed Claims by Allegation
Closed Claims with Paid Indemnity of ≥ $10,000
Treatment/care
56.0%
56.2%
Patients’ rights/abuse/ professional conduct
14.3%
18.2%
Assessment
5.1%
9.7%
Medication administration
10.1%
8.2%
Monitoring
7.5%
4.3%
13
Average Total Incurred by Allegation
Closed Claims with Paid Indemnity of ≥ $10,000
Medication administration
$214,035
$279,507
Treatment/care
$209,937
$241,645
Assessment
$192,880
$227,069
Patients’ rights/abuse/ professional conduct
$165,732
$205,363
Monitoring
$265,010
$202,634
Analysis of Treatment/Care Allegations
Figures 14 and 15 provide a summary of the claim distribution and average total incurred amounts for professional liability closed claims by top treatment/care allegations.
An example of a claim involving improper management of medical patient or complication is noted below:
14
Distribution of Closed Claims for Treatment/Care Allegations
Closed Claims with Paid Indemnity of ≥ $10,000
32.4%
26.3%
11.8%
9.2%
6.1%
15
Average Total Incurred for Treatment/Care Allegations
Closed Claims with Paid Indemnity of ≥ $10,000
Improper management of obstetrical patient
$540,861
Improper management of surgical/post anesthesia care
$421,329
Improper technique or negligent performance of treatment
$205,601
Improper management of medical patient or complication
$170,865
Failure to implement protocols
$123,252
Analysis by Injury
16
Distribution of Closed Claims by Top Injury
Closed Claims with Paid Indemnity of ≥ $10,000
Death
40.9%
50.2%
Fracture/dislocation
6.4%
7.9%
Infection/abscess/sepsis
6.8%
6.2%
Burn
2.2%
4.5%
Head/brain injury
2.9%
4.3%
17
Average Total Incurred by Top Injury
Closed Claims with Paid Indemnity of ≥ $10,000
Fetal/infant birth-related brain damage
$660,980
$759,485
Head/brain injury
$408,295
$379,270
Amputation
$292,586
$346,266
Death
$204,363
$267,343
Emotional/ psychological harm/distress
$50,248
$189,276
Responding to Adverse Events
Adverse events should be reported per policy requirements, and an incident report should be completed promptly. Adverse events include incidents involving one or more of the following:

A patient is harmed or sustains an injury.

Potential clinical significance.

An outcome differs from anticipated results.

An unexpected safety crisis.
Ready to enhance your risk management education?
Stay up to date on industry insights, trends, and tips when you sign up to receive our exclusive monthly newsletter. You’ll receive case studies, industry insights, articles, videos, webinars, and more!
Fill out my online form.